Map Portfolio
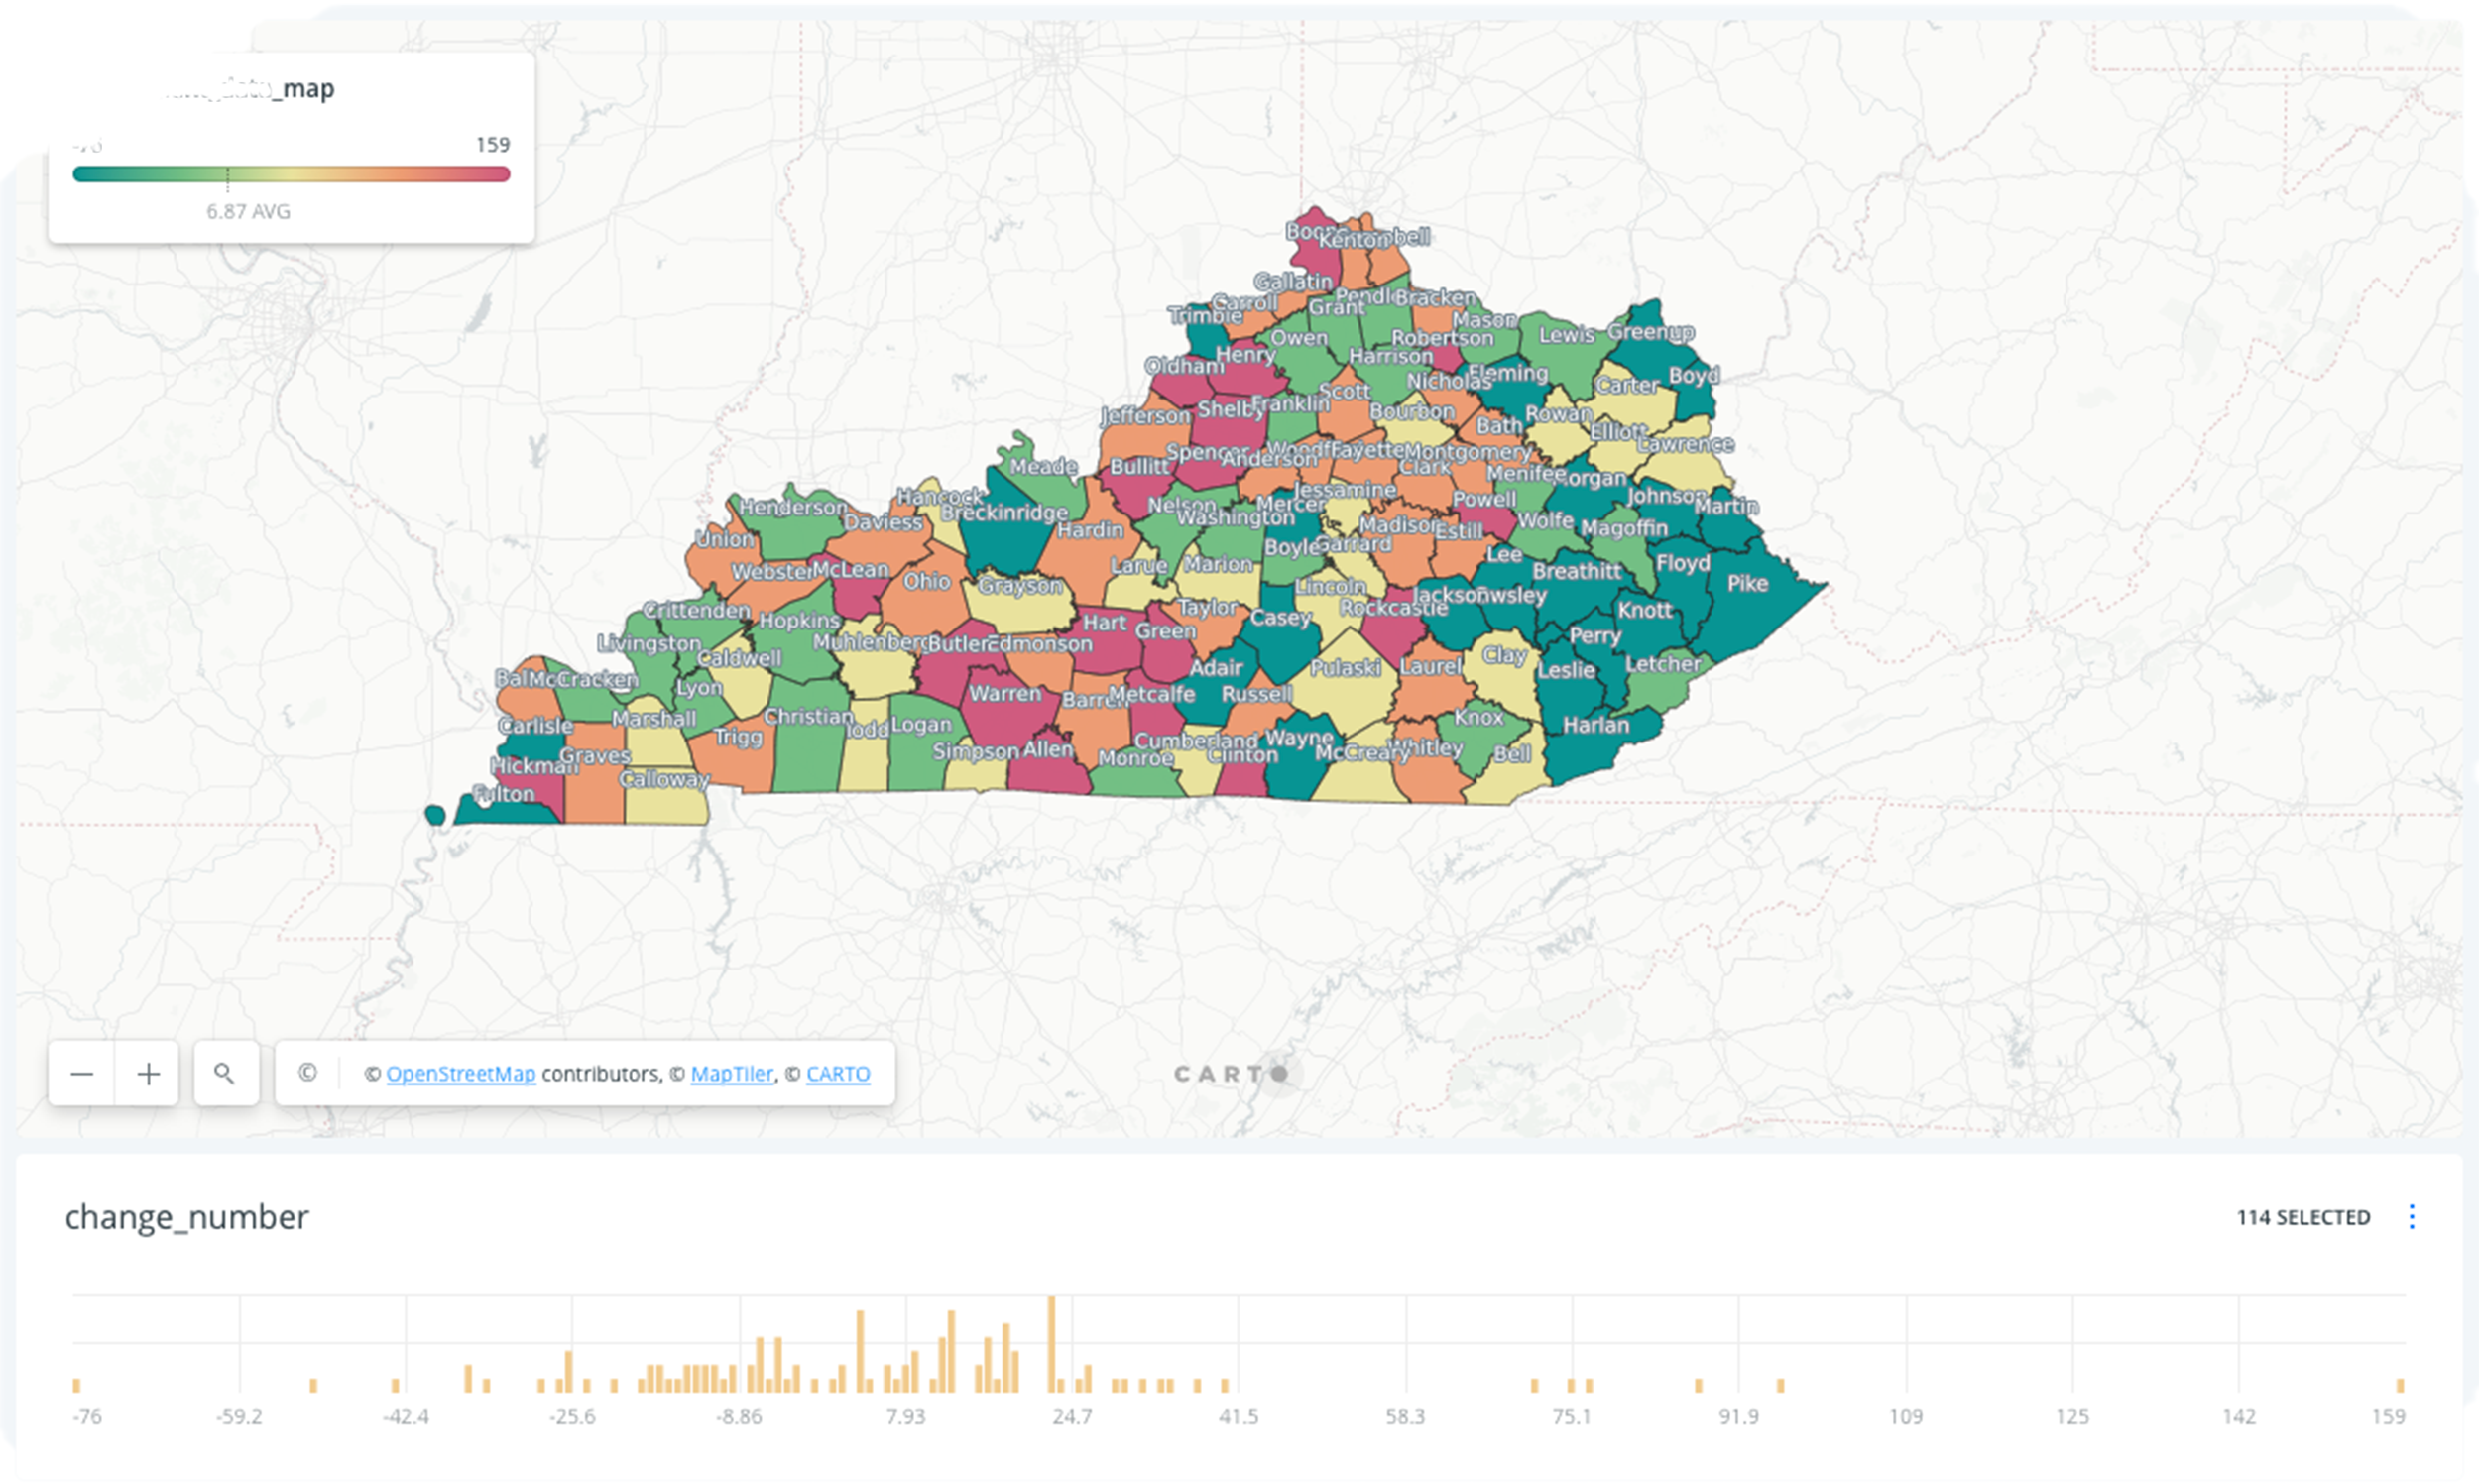
The data was collected from KY State Police total accident report by county, to analyze if there has been an increase in auto accidents in Kentucky counties since the introduction of smart phones.
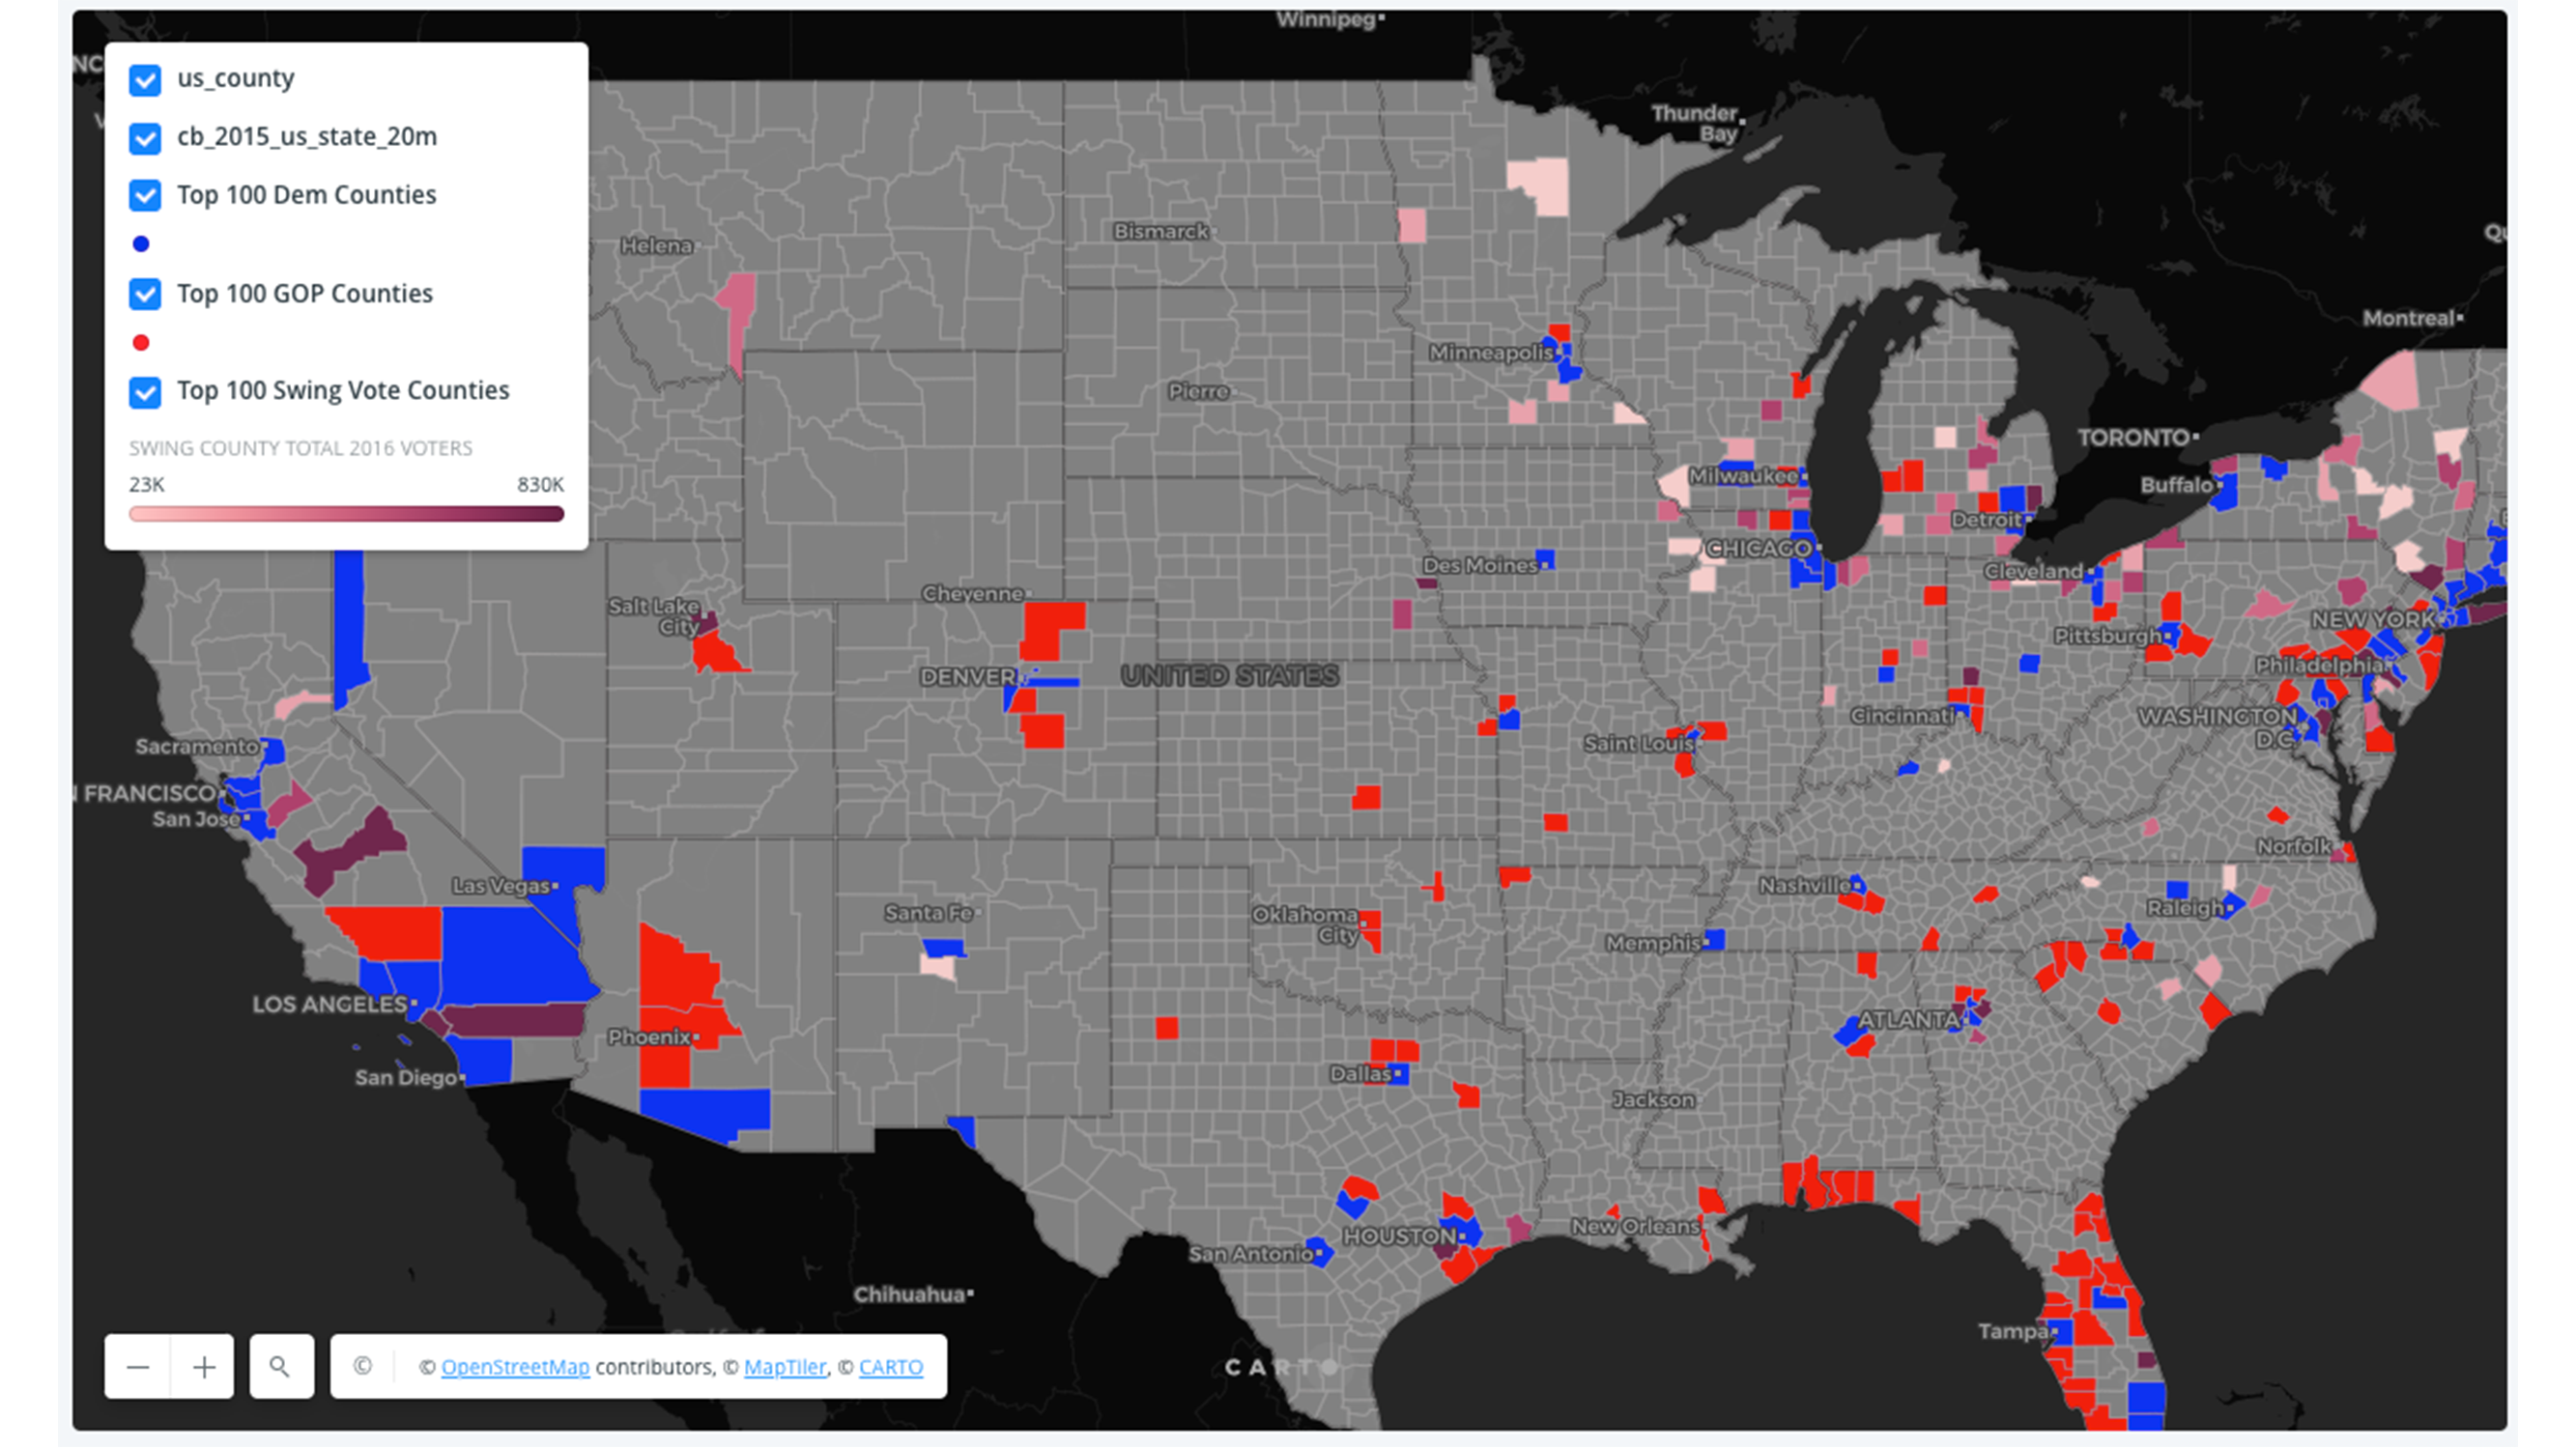
The features of this map is to identify, by voter counts, the top 100 counties that did not register a majority for the same party in the 2012 and 2016 Presidential Election.
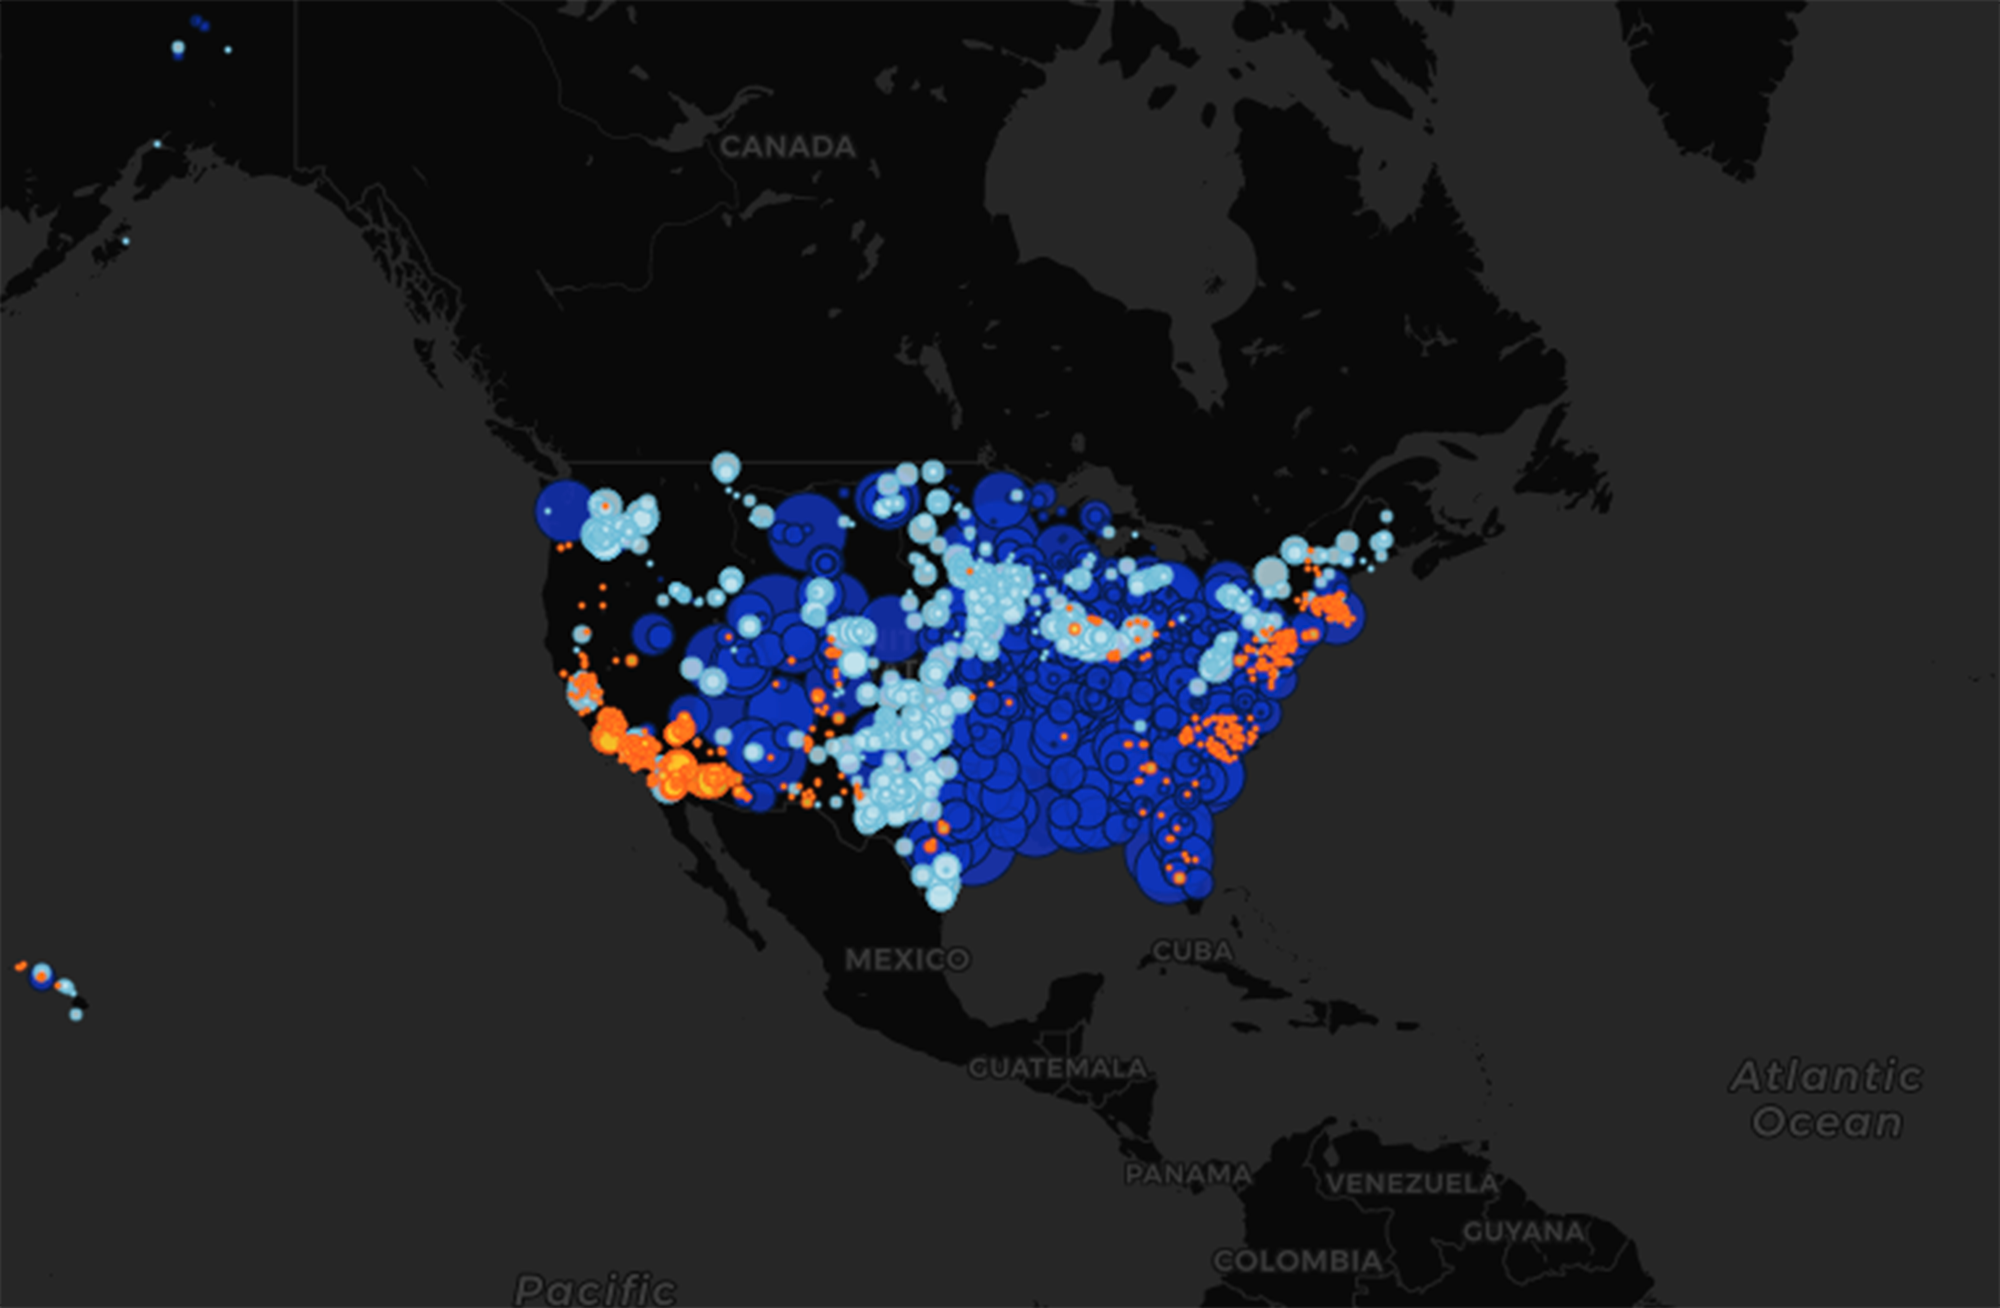
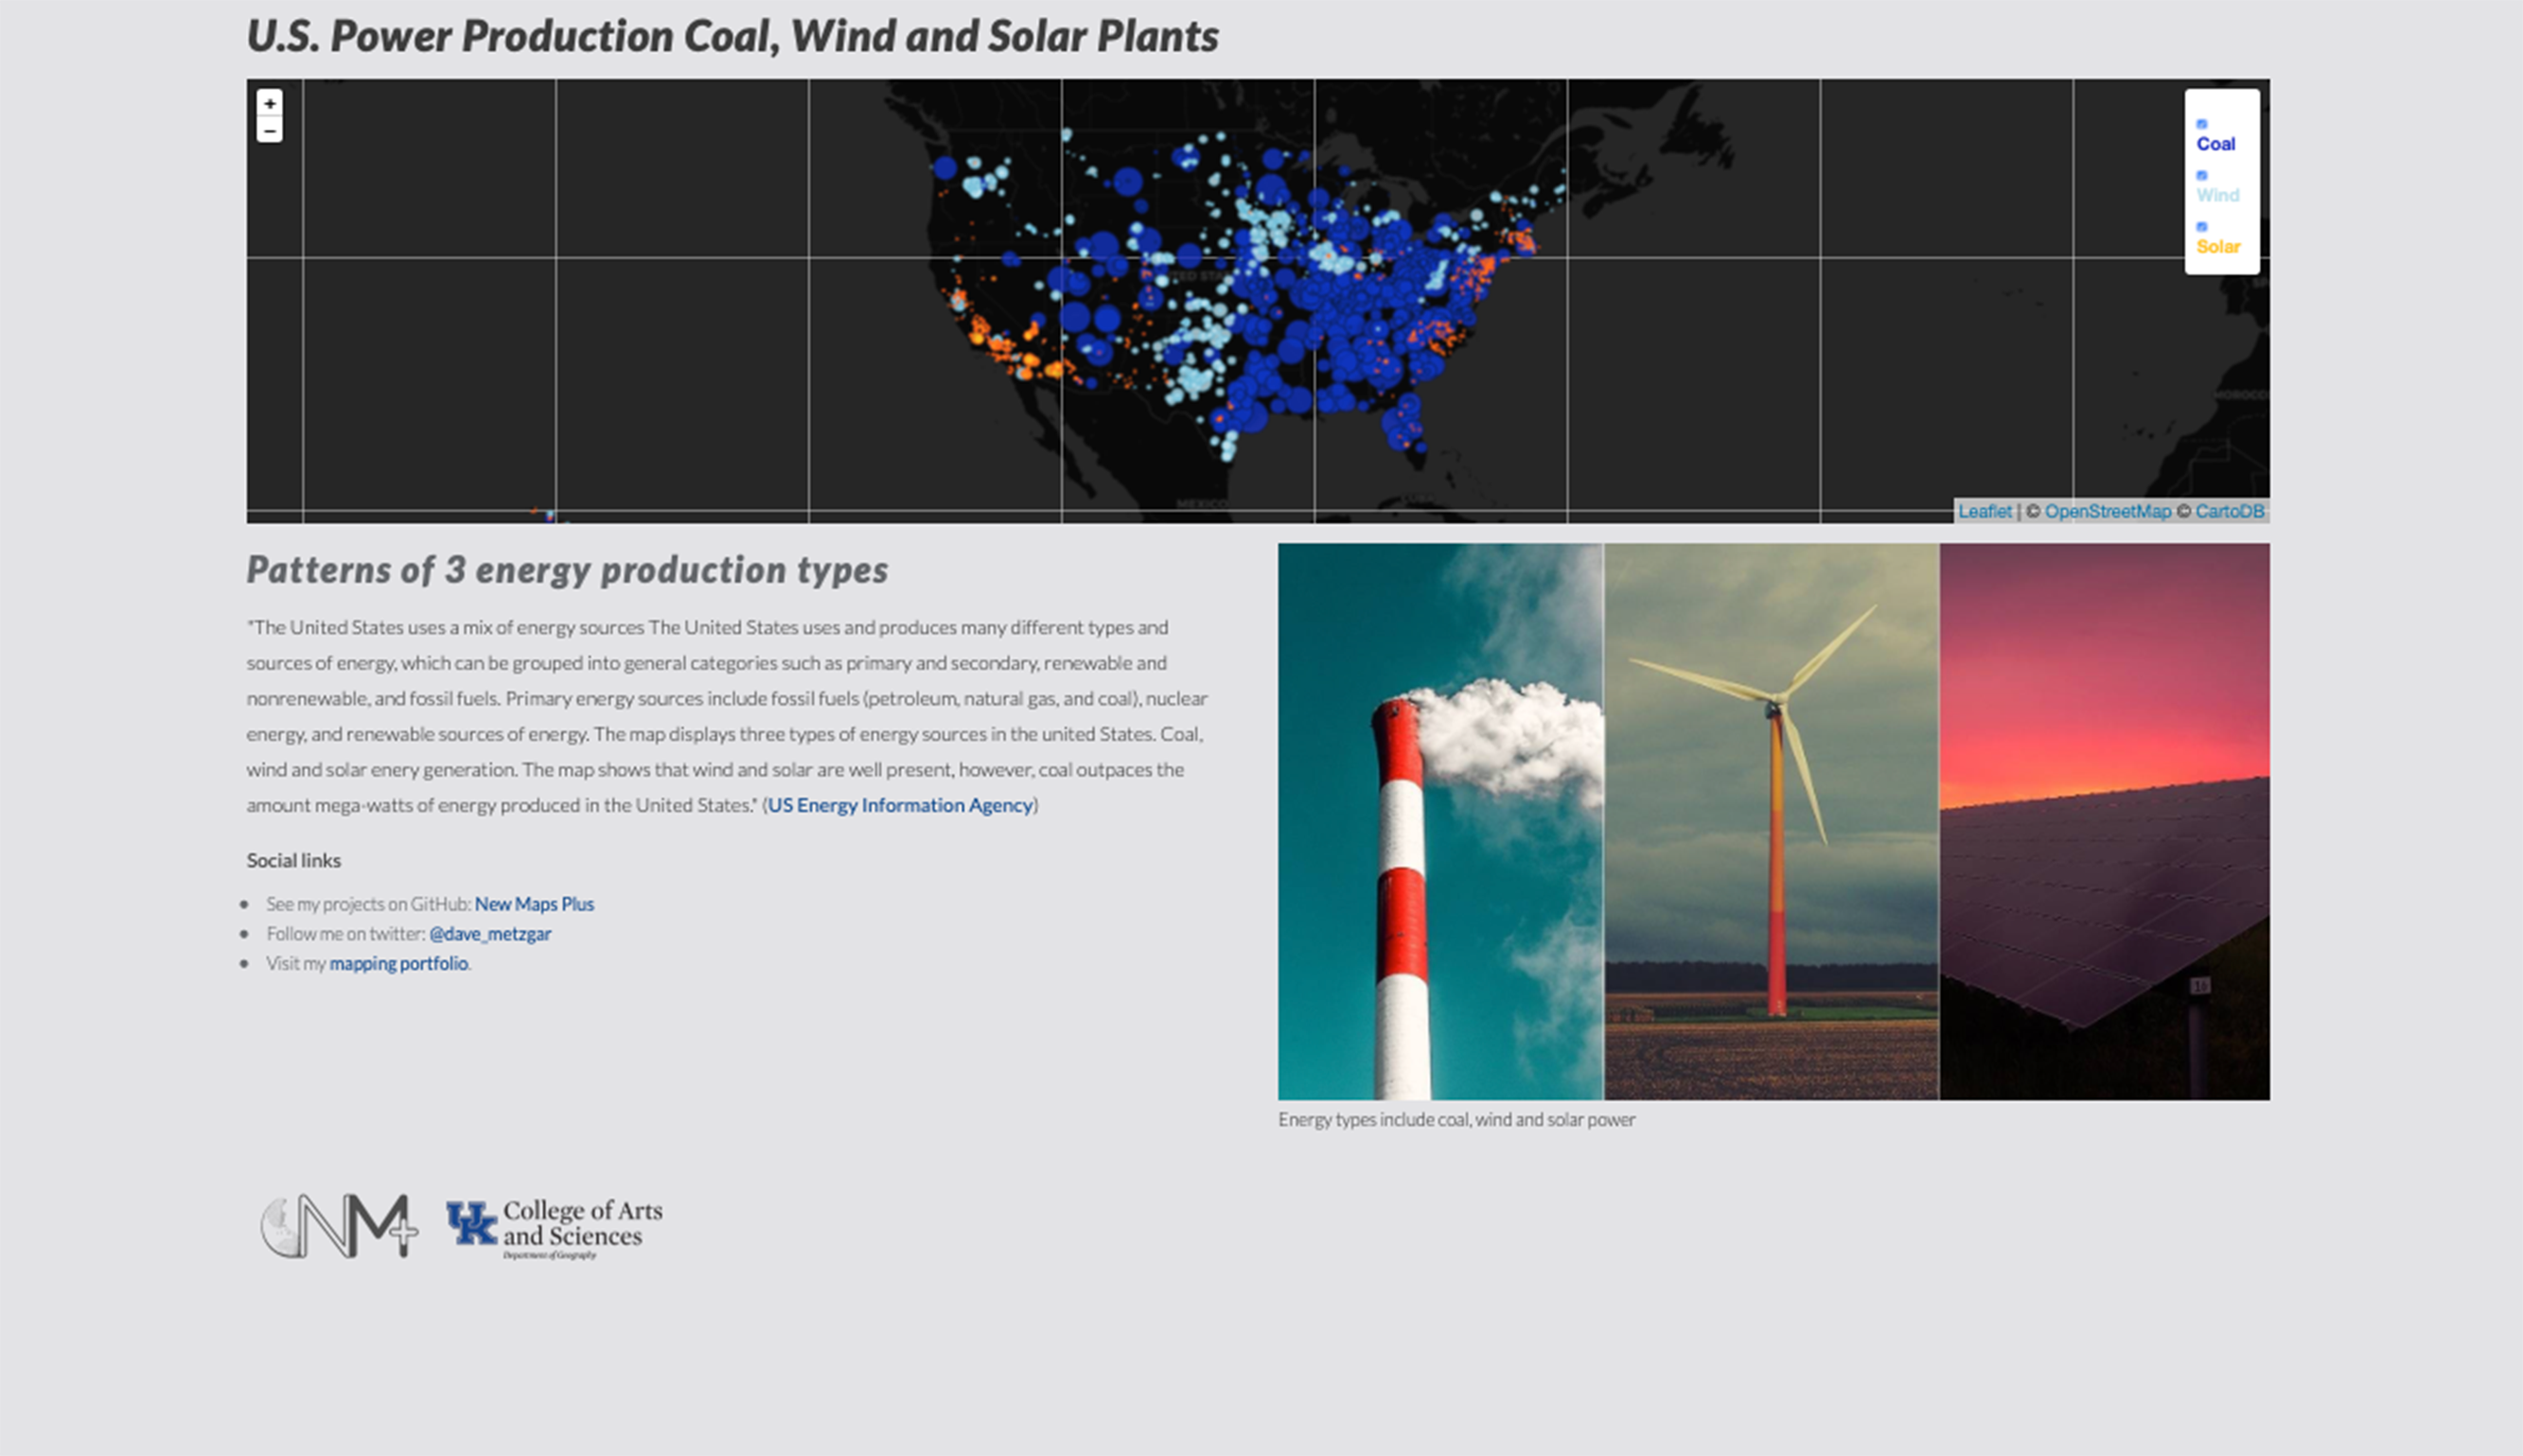
Primary energy sources include fossil fuels (petroleum, natural gas, and coal), nuclear energy, and renewable sources of energy. The map displays three types of energy sources in the united States - coal, and solar energy.
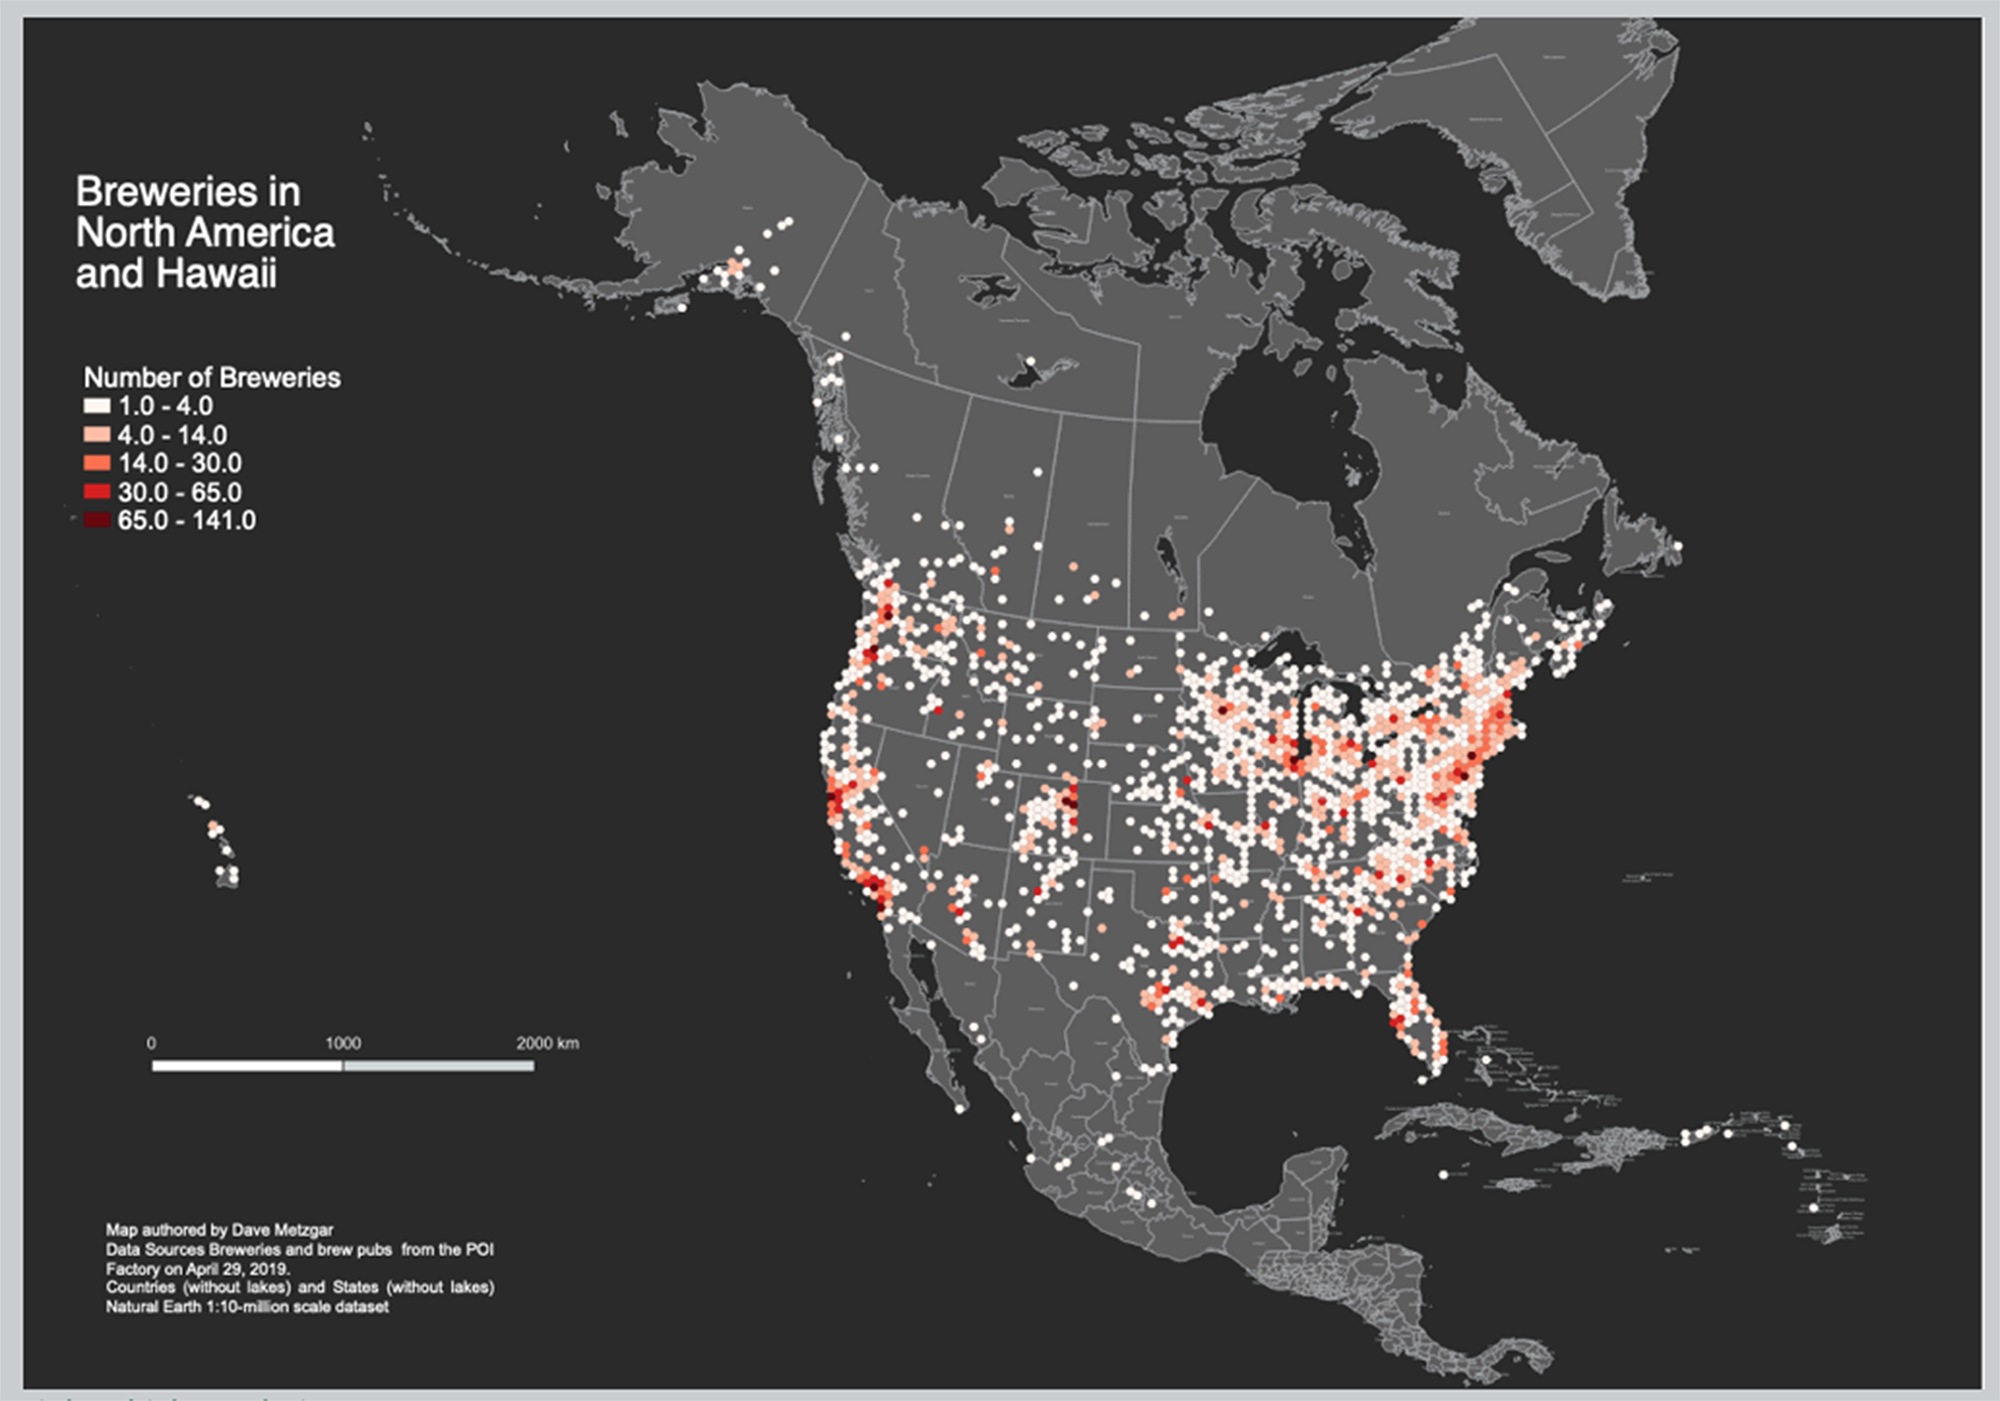
This map was create as a lab to find high-density areas of breweries for company looking to identify a new location to maximize business with a 25 km radius due to shipping requirements.
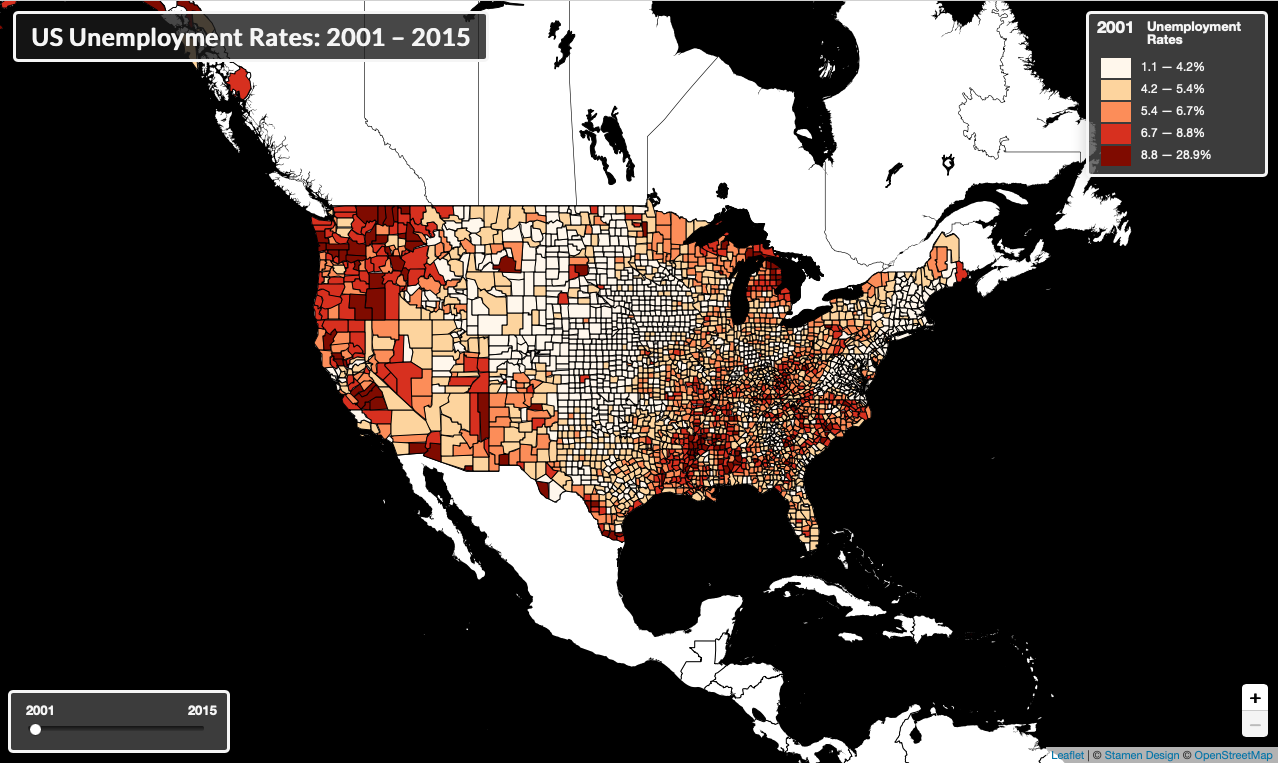
The data breaks down by percentage the unempoyment by county in the US 2006-2015.
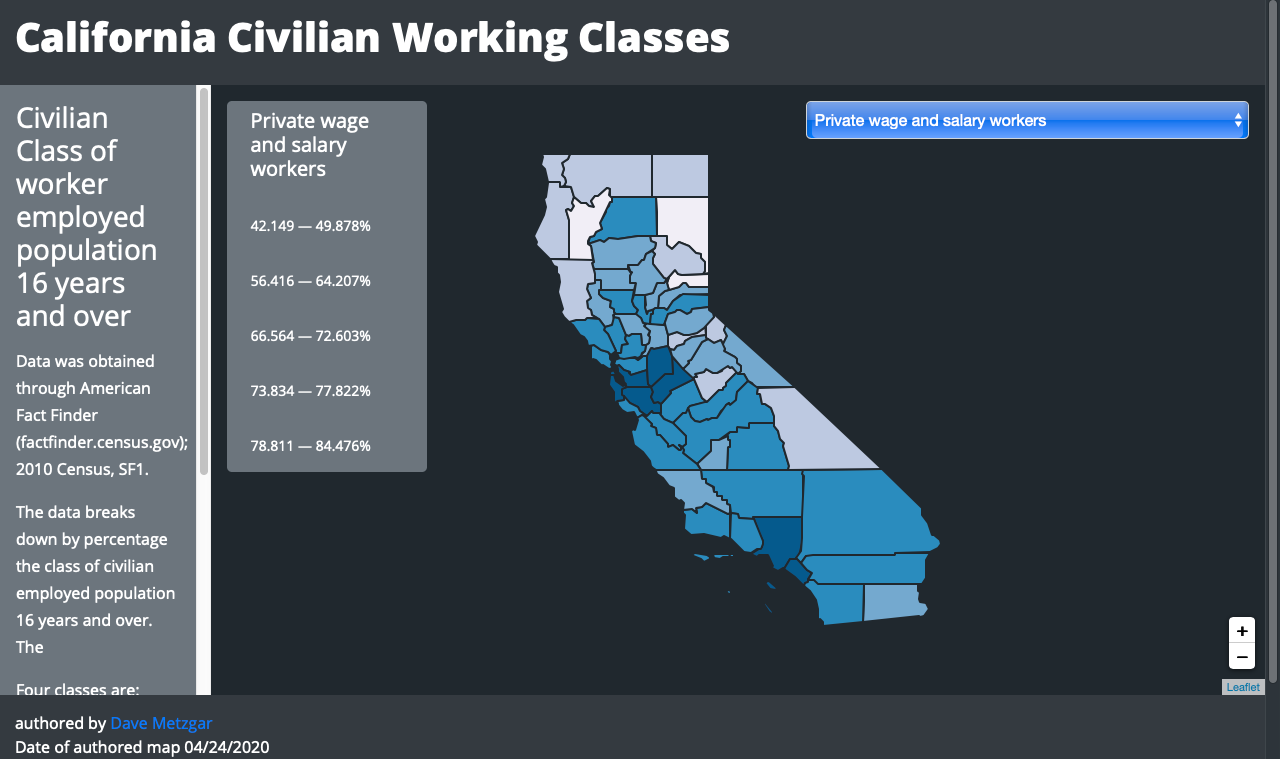
The data breaks down the State of California's classes of civilian employed population 16 years and over.
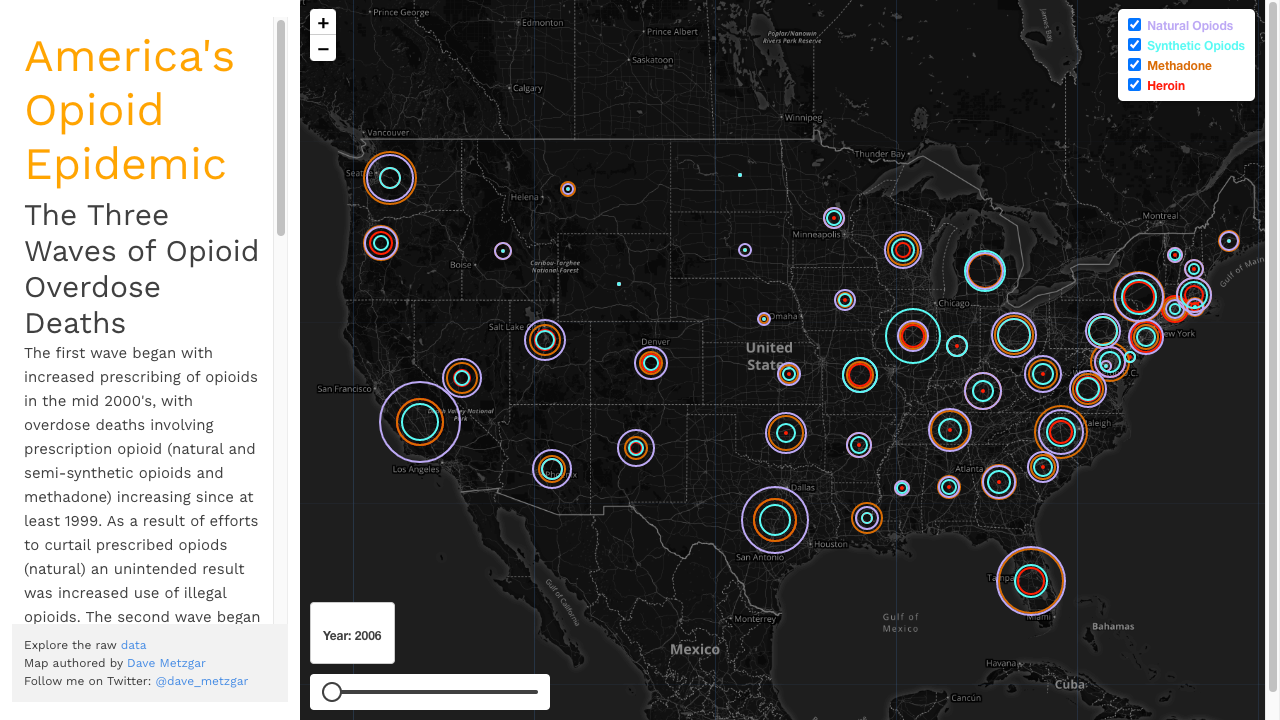
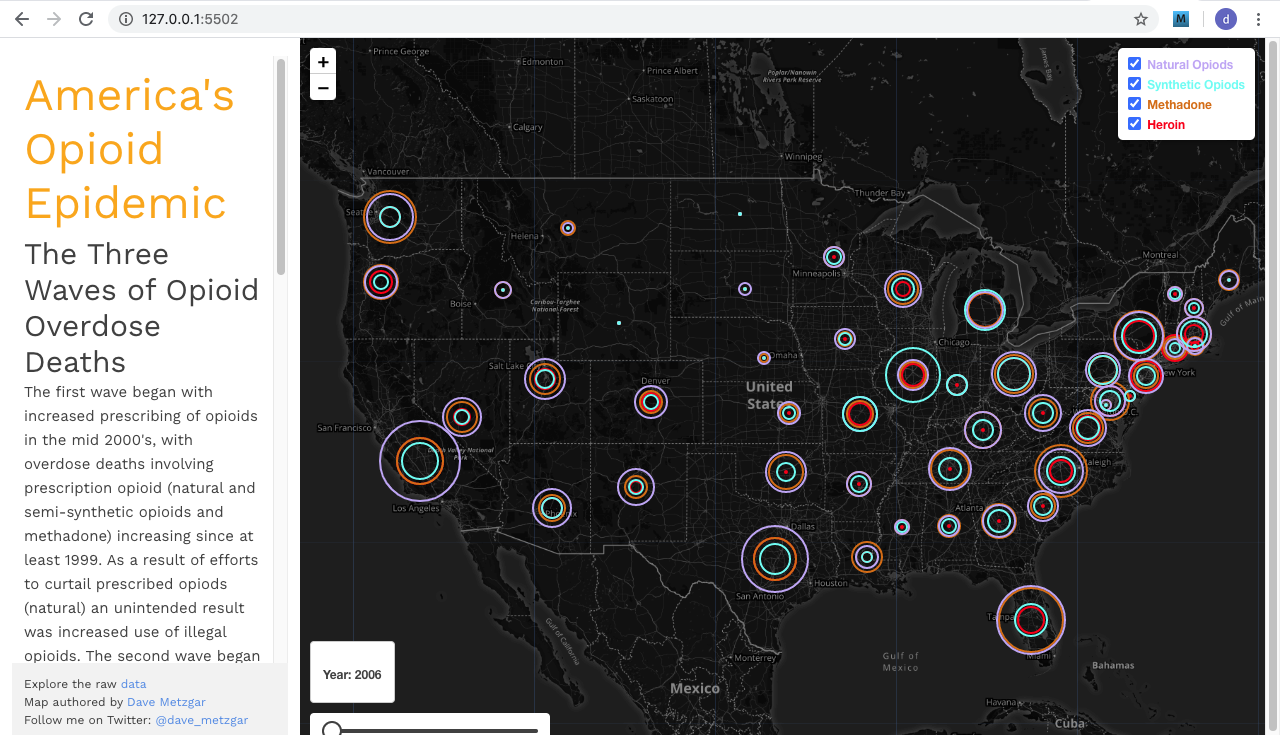
The data breaks down the opioid deaths in the US from 2006 to 2018.